Donington Classic

April 12-13

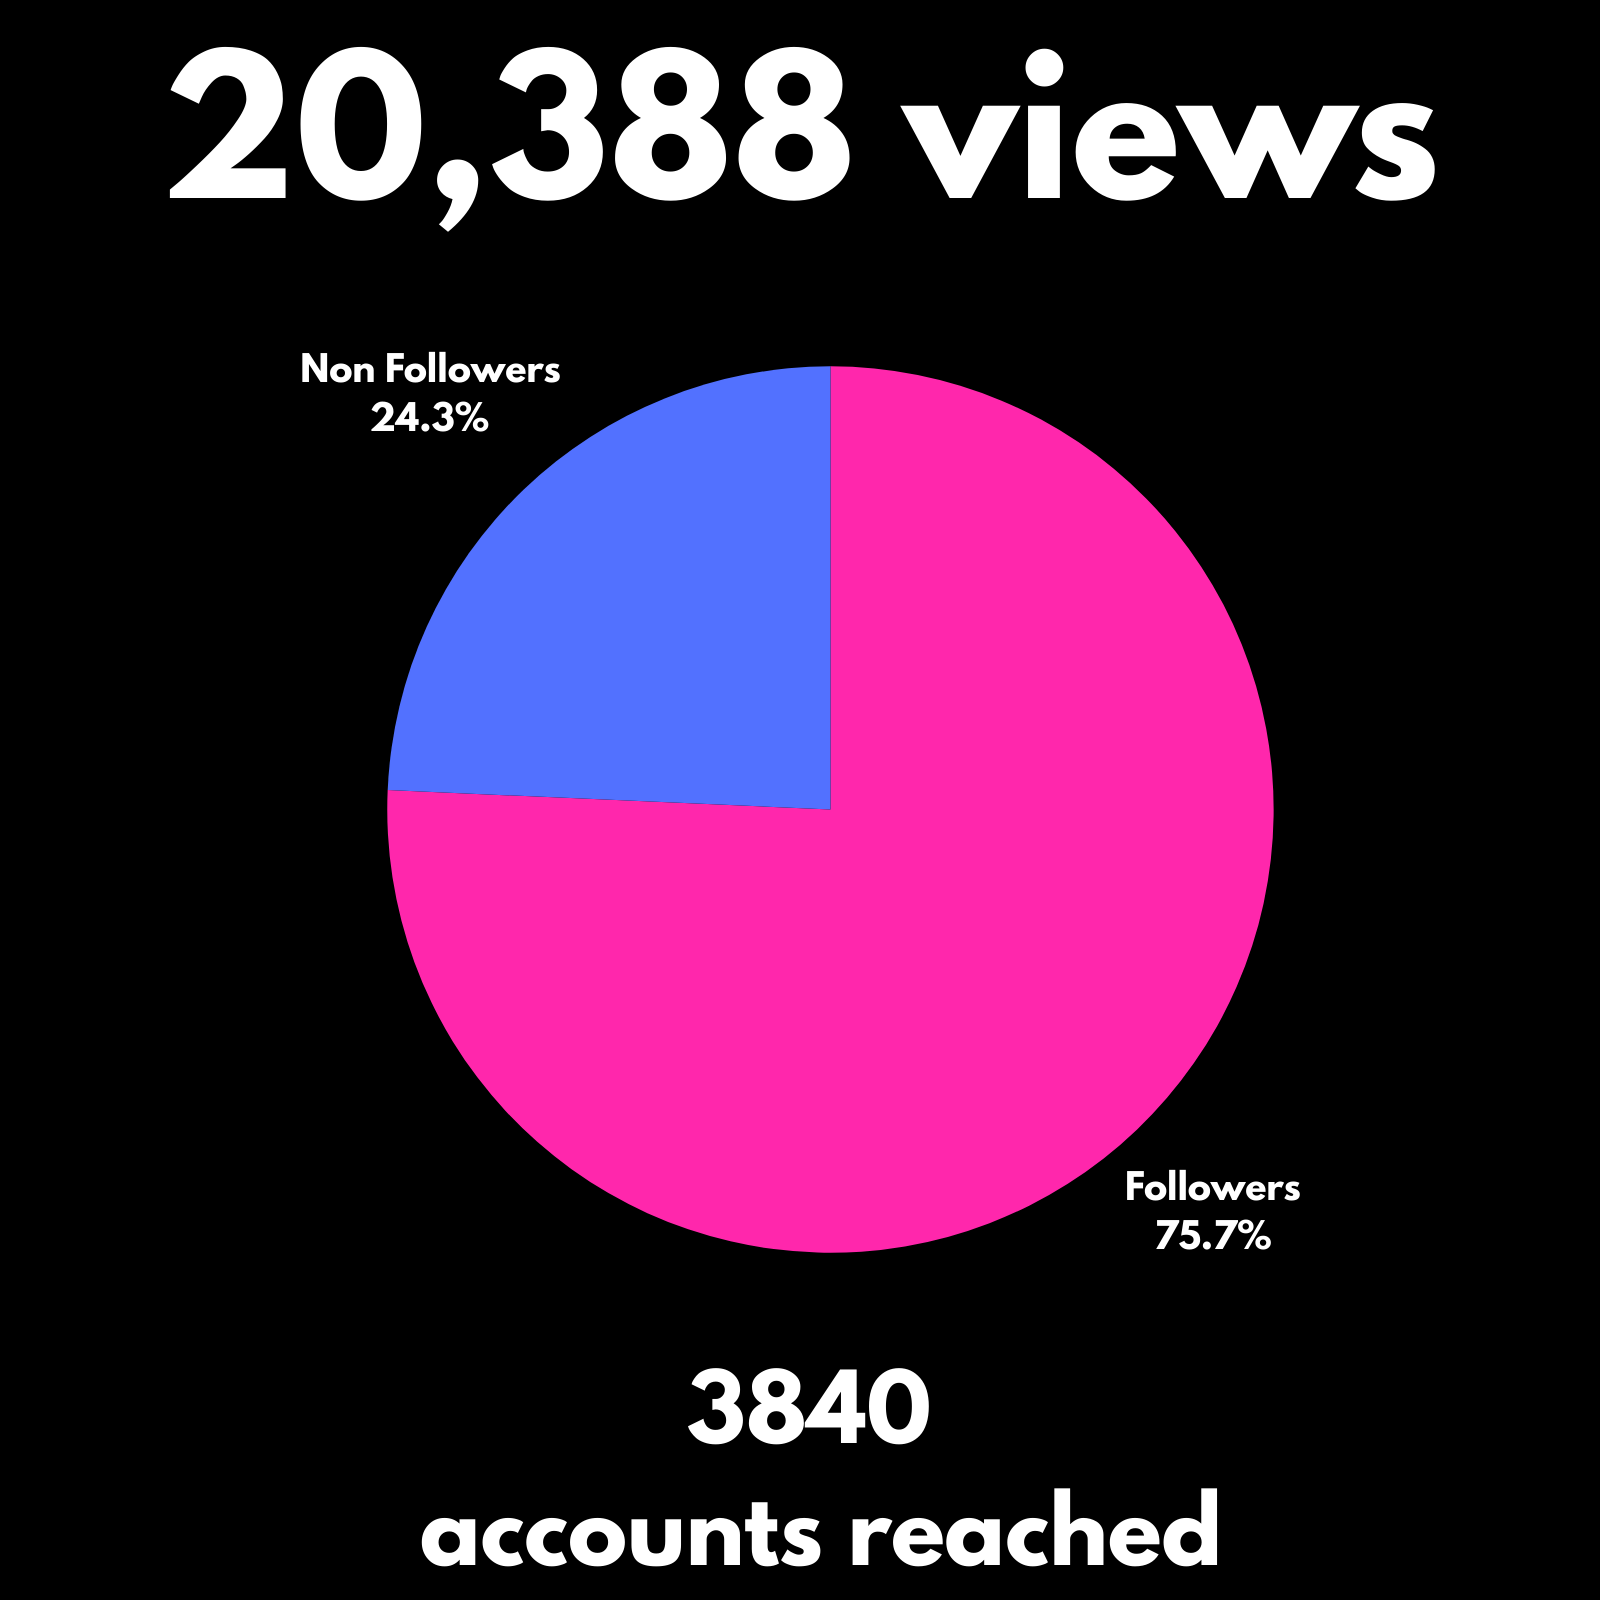
Classic Sports Car Club Metrics

A pink and blue pie chart shows engagement metrics with 20,388 views, 75.7% followers, 24.3% non-followers, and 3,840 accounts reached.
A pie chart showing that 92.2% of 316 accounts engaged, totaling 293 interactions, are followers and 7.8% are non-followers. The chart has a large pink section representing followers and a smaller blue section for non-followers. The title at the top reads '933 interactions'.
Black background with white text indicating social media post statistics: maximum views on one post is 3.6k, maximum likes on one post is 100.
Black background with white text reading '8 followers gained'

Cadwell Classic

May 17-18

Pie chart showing the distribution of views and followers reached, with a total of 26,747 views. The pie chart has two segments: pink representing followers (65.4%) and blue representing non-followers (34.6%). The text below the chart states 4,235 accounts reached.
Pie chart illustrating 443 social media interactions, with 90.5% (203 accounts) being followers shown in pink, and 9.5% non-followers shown in blue.
Black background with white text displaying social media metrics, stating maximum views of 4K and maximum likes of 69 on one post.
Text overlay stating '24 followers gained' over a black background.

Silverstone Classic

June 14-15

Pie chart showing social media account reach with 21,918 views, 73.7% followers and 26.3% non-followers, totaling 3,122 accounts reached.
Pie chart showing 385 social media interactions, with 64.1% followers (283 accounts) and 35.9% non-followers, on a black background with large white text.
Text overlay on black background displaying social media statistics: maximum views on one post is 6,000; maximum likes on one post is 232.
Graphic with black background and white text that says '9 followers gained'.