Silverstone - Round 2
April 25-27
Scorpio Motorsport Metrics
28 Day Summary
April 2-30
Tiktok
Silverstone - Round 2
April 24-27
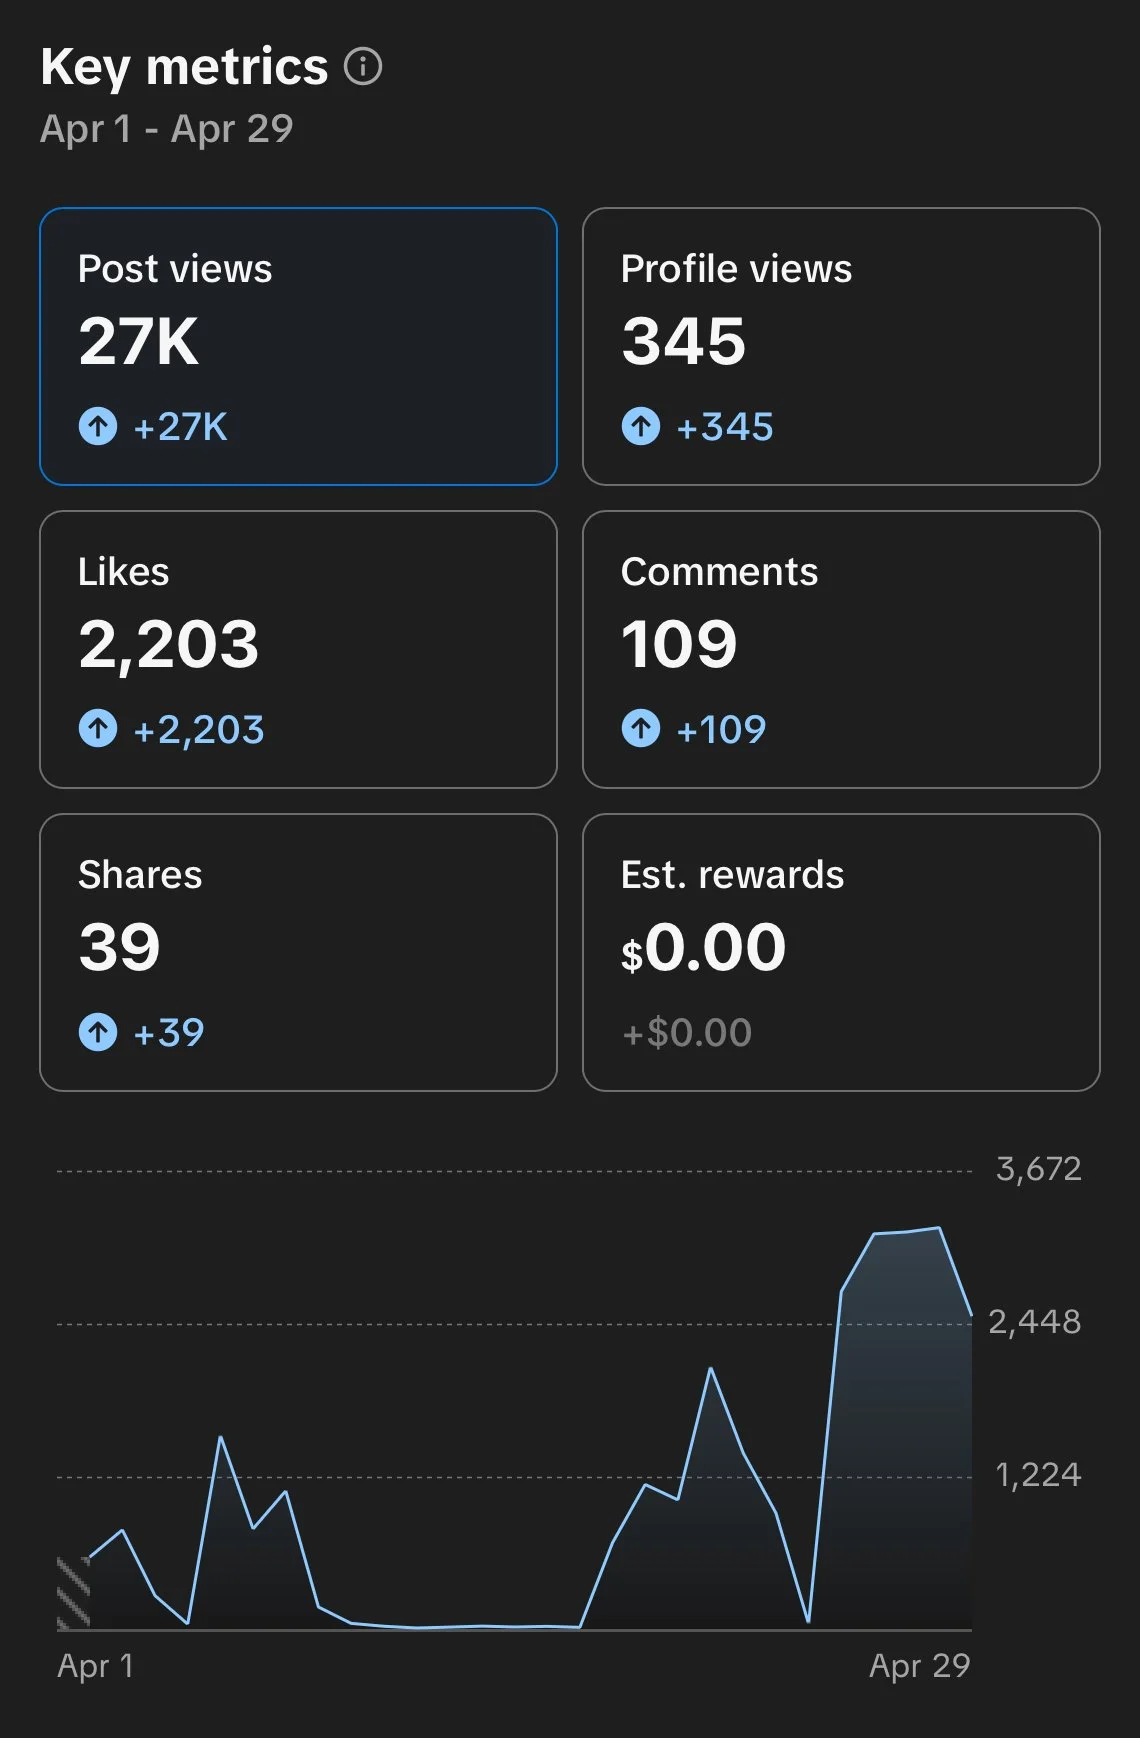
28 Day Summary
April 1-29
Silverstone - Round 2
April 25-27


28 Day Summary
April 2-30


Tiktok
Silverstone - Round 2
April 24-27


28 Day Summary
April 1-29